Reviewing conversations
Every conversation your agent has—whether from the Playground, a public link, or production—is recorded and available for review. Navigate to Conversations from the main menu to see them all.
Conversations list
The conversations list shows all conversations in a sortable table. Use the search bar to find conversations by caller phone number, agent name, or conversation ID, or narrow the list by date using the From and To pickers. You can customize which columns are visible with the Columns button.
Several columns support inline filtering—look for the filter icon in the column header. Click it to open a multi-select dropdown where you can filter by evaluation score, agent, version, topics, status, environment, or completion reason. Active filters show a badge on the icon.
The table displays these columns:
| Column | Description | Filterable |
|---|---|---|
| ID | Truncated conversation ID | No |
| Start time | When the conversation started — click to sort ascending/descending | No |
| Evaluation score | Primary evaluation result shown as star rating, "Skipped", or "Not evaluated" | Yes |
| Duration | Total call length | No |
| Agent | Agent name | Yes |
| Version | Agent version number | Yes |
| Topics | Detected topics shown as chips | Yes |
| Status | Ongoing or Finished with colored icon | Yes |
| Environment | Development, Staging, or Production | Yes |
| Completion reason | How the call ended (Contact hung up, Transferred, Error, etc.) | Yes |
| Source | Origin: Playground, Public WebSocket, Twilio, or Genesys | No |
Environment, Version, and Source are hidden by default—use the Columns button to toggle them. On agent-specific pages, additional columns appear for each non-primary evaluation rule.
Click any row to open the conversation detail in a new tab.
Handover view
When a voice call is transferred to a human, the person picking it up needs the AI's context fast. Switch the Conversations page from Standard to Handover (top right) to see a focused list of recently handed-over calls, newest first.
Each handover is a card showing the caller's number, how long ago the call was handed over, the AI's summary of what happened, the reason it transferred, and the key facts it captured (such as estimated urgency, whether the caller was verified, and any identifiers like an order or card number). When more than one agent is handing off calls, an agent filter at the top right lets you focus on a single agent. Select a card to open the full transcript beside the list, or use the link to open the complete conversation in a new tab.
Team members with the Agent role for Voice land directly on this view.
Conversation detail
The detail page shows everything that happened during a single conversation. The conversation ID is shown at the top and can be clicked to copy.
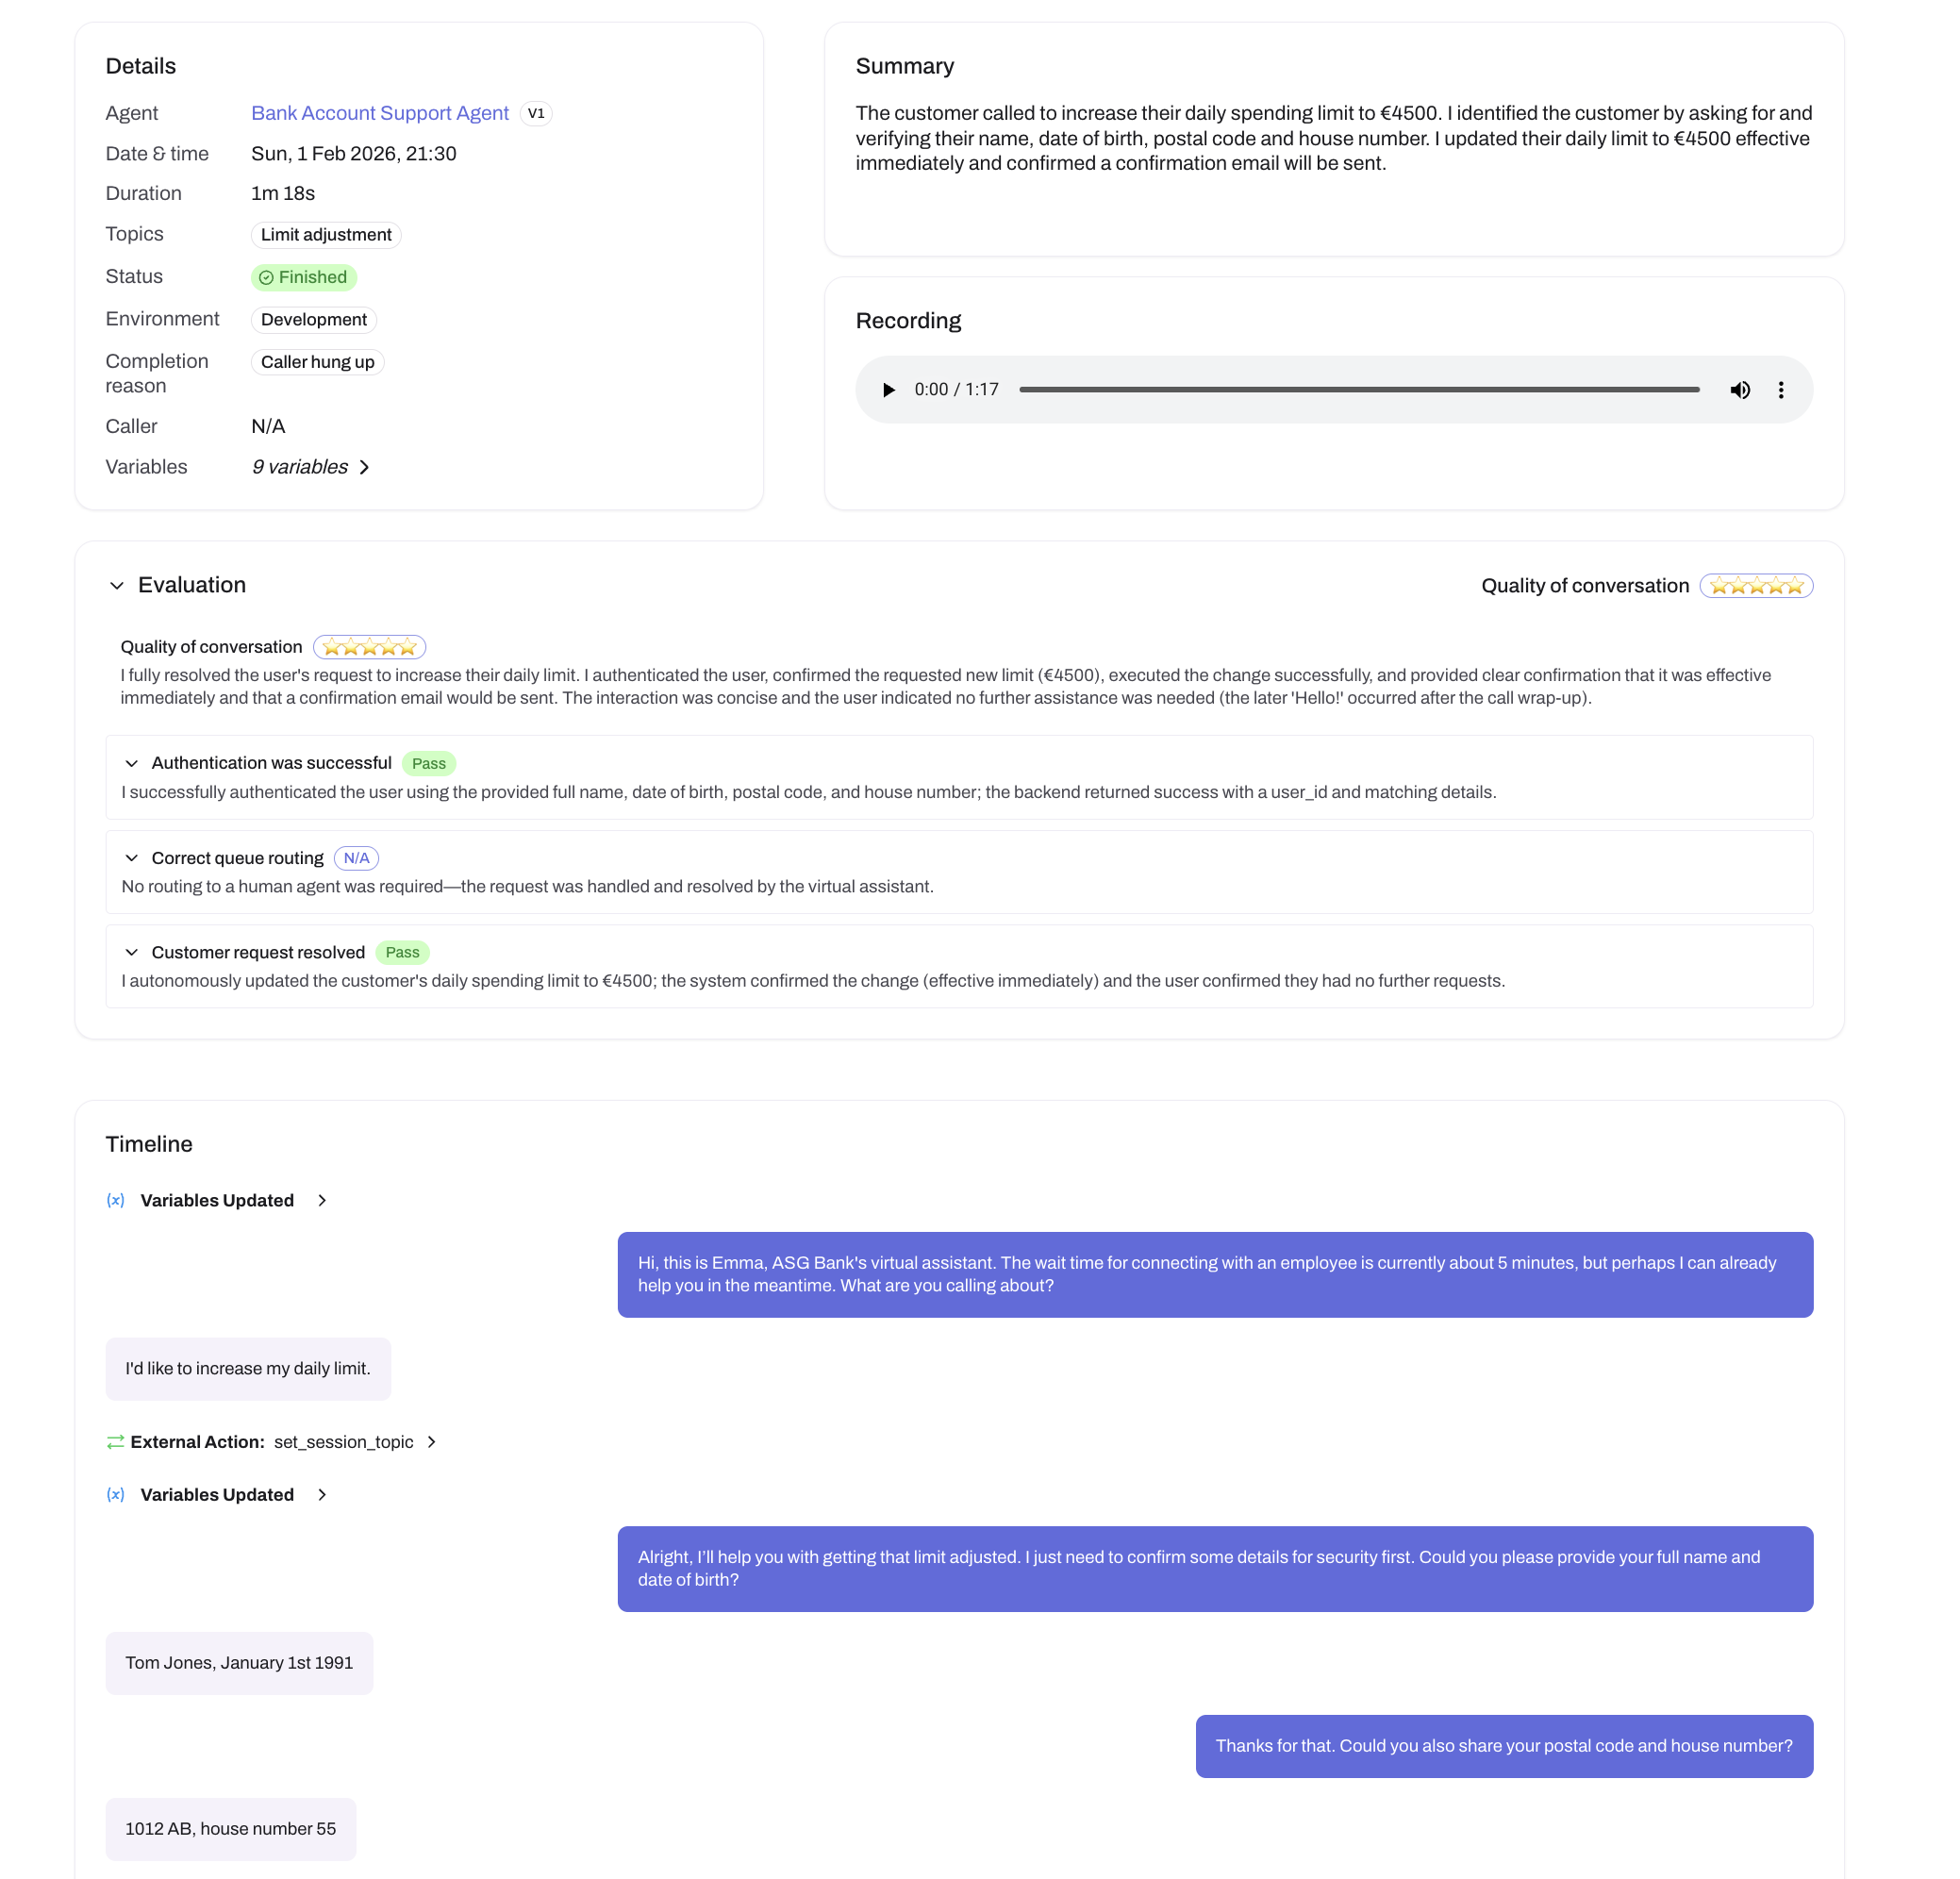 The conversation detail page shows metadata, an AI-generated summary, evaluation scores, and the full timeline
Details and summary
The top left panel shows conversation metadata: which agent handled the call (linking to the agent page with its version number), the start time, detected topics, call status, environment, completion reason, and the contact's phone number when available. If your agent uses variables, expand the variables section to see all collected values in a key-value table—nested objects are flattened using dot notation (e.g., call.from).
Additional fields for Genesys integrations
For Genesys conversations, the details panel also shows the Genesys Conversation ID (click to copy).
The right panel shows an AI-generated summary of the conversation. Summaries are generated once the conversation ends, provided it has enough content.
Recording
Every conversation includes a full audio recording with a built-in player. Recordings become available shortly after the call ends—you may briefly see a "Processing" state while the audio is prepared. If a conversation ended due to an error, the recording may not be available.
Reading transcripts tells you what was said, but listening to audio reveals tone, pacing, and customer emotion—useful for assessing overall conversation quality.
Evaluations
If you've configured evaluation rules, the evaluation section shows the primary rule score. Expand the section to see every rule's score and explanation.
Timeline
The timeline is the main transcript view, showing every event that occurred during the conversation in chronological order. Most events can be clicked to expand and reveal full details.
Messages appear as chat bubbles—user messages on the left, agent responses on the right.
State transitions show the from-state and to-state as chips with a success or failure badge. Expand to see the reason for the transition and any error details. See Dialogue Builder for how to configure states and transitions.
Guardrail triggers show the guardrail name and the action taken—Ignored, Nudge Agent, Handover, or Terminate—each with a distinct color and icon. Expand to see what triggered the guardrail and, for nudge actions, the private instructions sent to the agent.
External actions show the action name with a "Failed" badge if it errored. Expand to see the AI agent's input parameters, the actual API request body (if using a request body template), and the API response with its HTTP status code—color-coded green for success or red for errors.
Handover initiated shows the handover type with the destination phone number or queue ID. See handover actions for configuration.
Variables updated appears when conversation variables change during the call. Expand to see the updated values as formatted JSON.
DTMF events show digits collected from the caller's keypad, along with the collection reason (termination key pressed, maximum digits reached, or timeout).
Call events appear as visual dividers marking key moments—Handover to human agent when a call is transferred, and Call disconnected when the caller hangs up.
Errors are displayed with a severity level, an error code, and a message. They include a correlation ID you can click to copy, which is useful when working with support.
For ongoing conversations, use Listen & intervene to see the transcript update in real-time instead of reviewing after the fact.
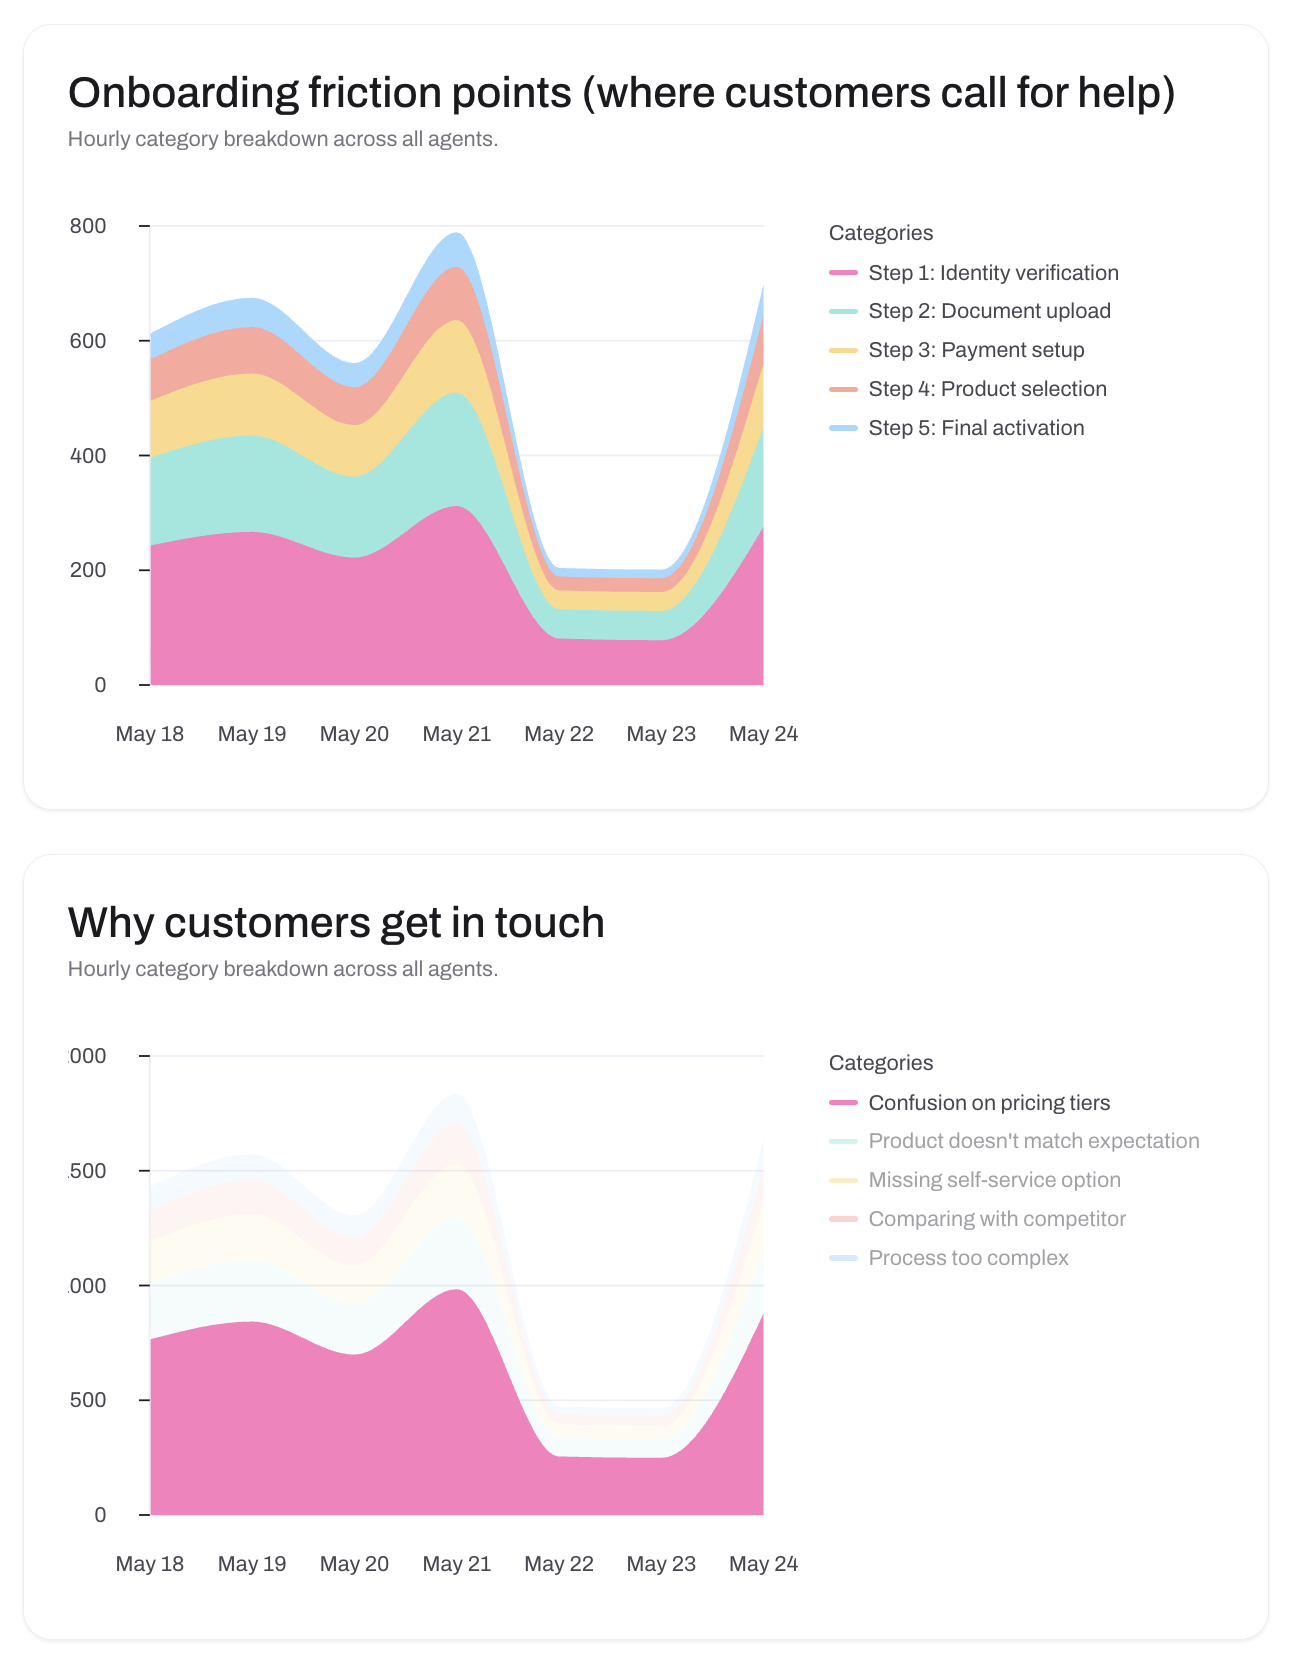 Topic analysis charts help you understand why customers are calling and where friction occurs
Exporting analytics data
The Analytics tab on any agent page has an Export button that downloads an Excel file with separate sheets for each chart: Conversations (count over time), Avg Call Duration, Topics, and one sheet per evaluation rule showing score breakdowns over time. A Conversation Details sheet lists every conversation with metadata (ID, start time, agent, version, phone number, duration, topics, status, environment, source, completion reason), evaluation scores, and a summary. Each evaluation rule gets two columns—a display value (e.g., the star rating) and a raw value (e.g., 5)—so you can use the raw values for formulas and analysis. All dates are native Excel dates, so you can sort and filter them directly.
Next steps
- Set up evaluation rules to automatically score conversation quality
- Use Listen & intervene to monitor live conversations